SAGUARO College Curriculum

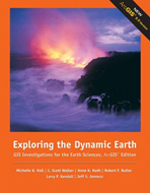
Exploring the Dynamic Earth
ArcGIS 9.1 and 9.2, 1st Edition
ArcGIS 3x
Exploring the Dynamic Earth explores the process that governs the large-scale structure of the Earth’s surface, plate tectonics. The module consists of five individual units and can be divided into two broad topics: plate tectonics itself and the geologic hazards that arise from the process. This module emphasizes three basic concepts: 1) heat is a driving force for plate tectonics; 2) present tectonic activity is a key to the past, and the past can be used to understand the future; and 3) hazards become disasters when people are affected.
The SAGUARO Exploring GIS Investigations for Earth Science curriculum requries the use of ESRI’s ArcView® GIS software version 3.0 for Macintosh or 3.2 and higher for PC.
Unit 1 – Searching for Evidence Overview / Sample
Students investigate patterns in the global distribution of earthquakes, volcanoes and topographic anomalies to discover the locations and properties of different types of tectonic boundaries.
Highlights
– Topographic Profile Movies
– Block Diagram screen-shot
Unit 2- Exploring Plate Tectonics Overview / Sample
Students explore patterns of seafloor age and calculate the rate of spreading in the Atlantic Ocean. They use their results to understand the history of opening the Atlantic basin and how spreading rates change over time. Next, they compare these rates to the Pacific Ocean to see that spreading rate is not globally uniform. Using plate motion vectors, students predict future trends of plate motion and calculate the time required for the Juan de Fuca plate to be completely subducted. They calculate seafloor spreading rates for the Hawaiian-Emperor chain using hotspot volcanism. Finally, they look at the motion of California along the San Andreas Fault and see that San Francisco and Los Angeles are slowly moving closer to each other.
Highlights
– Seafloor spreading screen-shot
Unit 3 – Earthquake Hazards Overview / Sample
Students examine earthquake data to locate the largest and most damaging earthquakes. They explore trends in deadly earthquakes throughout history. Students learn about factors that affect earthquake destruction, and they learn about recurrence intervals and how to use them to predict future risks. Finally, they examine the relationship between population, national wealth, and seismic risk.
Highlights
– Taiwan earthquake damage
Unit 4 – Volcano Hazards Overview
Students study historical volcanoes, learn about the volcanic explosivity index (VEI) scale, and determine the recurrence interval for volcanic eruptions. They become familiar with different types of volcanic eruptions and investigate the effect of major eruptions on climate. Students conclude the unit with an examination of large (VEI 7-8) eruptions and learn how far the effects of the eruptions can spread.
Highlights
– Ashfall screen-shot
Unit 5- Tsunami Hazards Overview
Students are introduced to tsunamis and their behavior by analyzing two major tsunami events. Students learn what tsunamis are, how they form, how they affect communities, and how communities can prepare for tsunami events. Finally, students study the interaction between tsunamis and tides and examine tsunami trigger events with the goal of developing criteria to use to issue tsunami warnings.

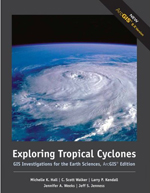
Exploring Tropical Cyclones
ArcGIS 9.1 and 9.2, 1st Edition
ArcGIS 3x
Exploring Tropical Cyclones explores the occurrence, characteristics, and hazards of tropical cyclones by examining world data sets of storms occurring during the past century. This module emphasizes six basic concepts: 1) heat is a driving force in generating tropical cyclones, 2) the Coriolis effect initiates rotation of tropical cyclones, 3) differences in temperature and pressure create winds, 4) the physics and behavior of tropical cyclones can be understood, allowing predictions to be made, 5) the high population density on the coastlines of the US results in high levels of hurricane risk, and 6) better observation, forecasting, and communication can minimize hurricane-related damage and fatalities.
The SAGUARO Exploring GIS Investigations for Earth Science curriculum requries the use of ESRI’s ArcView® GIS software version 3.0 for Macintosh or 3.2 and higher for PC.
Unit 1 – Recipe for a Cyclone Overview / Sample
Students explore where, when, and why tropical cyclones occur, explain when tropical cyclones form and relate their seasonal nature to the hemisphere in which they form, and relate seasonal sea surface temperature conditions to tropical cyclone formation.
Unit 2 – The Life of a Cyclone Overview / Sample
Students identify basic tropical cyclone structure and rotation, identify the stages in the life cycle of a tropical cyclone, from tropical disturbance through hurricane, relate tropical cyclone images to data describing central pressure and wind speed, and show where Atlantic hurricanes form, how they move, where they die out, and how their location affects their wind speed.
Unit 3 – Hurricane Hazards Overview
Students use appearance and surface data to determine hurricane category, describe the relationship between Saffir-Simpson category and economic impact on society, compare characteristics of destructive hurricanes to those of “average” hurricanes, investigate hurricanes and society in pre-historical, historical, and present-day context, focusing on the role of coastal population growth on increasing hurricane hazards, and identify hurricane risks for major East Coast cities using hurricane landfall probability data.
Highlights
– Cyclone path screen-shot
Unit 4 – Hurricanes in the Big Apple Overview / Sample
Unlike previous units, the activities in this unit constitute a local case study of the risks involved in a direct hit by a major hurricane in New York City. In the case study, students 1) explore reasons for the extreme effects of the hurricane on the city, 2) examine potential impacts of the storm on society, and 3) plan procedures that might help the city keep its citizens safe.
Highlights
– NYC probability screen-shot

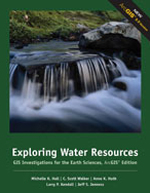
Exploring Water Resources
ArcGIS 9.1 and 9.2, 1st Edition
ArcGIS 3x
Exploring Water Resources uses two national-scale investigations, one local investigation, and two local case studies in which students explore the following concepts: 1) water on Earth exists in several large global reservoirs and moves between these reservoirs through the various processes collectively called the hydrologic cycle, 2) fresh water comprises a very small percentage of Earth’s water supply, and much of this fresh water is not easily accessible, 3) wind, weather fronts, convection, and topography determine where precipitation occur, 4) topography and other characteristics of the land surface determine how surface water moves, 5) human-related and environmental factors infl uence our ability to utilize water resources, 6) wise water management is a crucial factor in sustaining the current and future global population.
The SAGUARO Exploring GIS Investigations for Earth Science curriculum requries the use of ESRI’s ArcView® GIS software version 3.0 for Macintosh or 3.2 and higher for PC.
Unit 1 – Global Water Resources Overview / Sample
Students examine how the global water supply moves through the hydrologic cycle, estimate the size of important global water reservoirs, and explore methods of obtaining water from these reservoirs for human use. Using a scenario whereby global warming melts polar ice caps, students determine how changes in sea level affect human populations through the loss of habitable areas and croplands.
Unit 2- The Renewable Resource Overview / Sample
Students investigate factors influencing global and regional precipitation patterns and examine the ecological and socioeconomic consequences. Students also examine the influence of topography and land characteristics on surface water flow. Finally, they examine the relationship between precipitation and discharge in important U.S. watersheds, and learn how biological processes interact with climate to affect runoff.
Highlights
– North America rivers & drainage basins screen-shot
Unit 3 – US Water Use Overview / Sample
Students explore relationships between precipitation and water use patterns across the U.S. They investigate state and county water use in major economic sectors (domestic, agricultural, power, etc.), and gain an understanding of the critical importance of this resource and the complex issues that are involved in its management.
Unit 4 – A Thirsty Town in the Desert Overview
The activities in this unit focus on a local case study of the challenges of obtaining and providing water as well as the economic and environmental consequences of ground water removal in Tucson, Arizona.
Highlights
– Tucson precipitation contours screen-shot
– Tucson water quality screen-shot

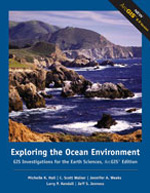
Exploring the Ocean Environment
ArcGIS 9.1 and 9.2, 1st Edition
ArcGIS 3x
Exploring the Ocean Environment investigates the processes that develop ocean basins and drive ocean currents, as well as the inevitable ocean-atmosphere interactions. It concludes with an examination of the delicate balance of the ocean environment, looking at marine productivity and the development of dead zones.
The SAGUARO Exploring GIS Investigations for Earth Science curriculum requries the use of ESRI’s ArcView® GIS software version 3.0 for Macintosh or 3.2 and higher for PC.
Unit 1 – The Ocean Basins | Sample
Students examine the dynamic nature of ocean basins and the processes that form and continually reshape them. Students investigate seafloor age, depth, and plate tectonic processes. The unit culminates in an exercise evaluating competing hypotheses for the age distribution of the seafloor.
Unit 2 – Oceans in Motion | Sample
Students examine how wind, temperature, and salinity influence the movement of ocean water in surface and deep-water currents. They also examine the direction, speed, and temperature of surface currents as they seek to uncover patterns in the movement of surface waters in the ocean basins. The unit underscores the importance of currents in distributing energy, nutrients, and dissolved gases around the globe.
Unit 3 – Ocean-Atmosphere Interactions | Sample
Students investigate how the oceans and atmosphere interact to moderate Earth’s climate. This includes an exploration of how the distribution of land and ocean influences the transfer of energy in each hemisphere. They also conduct an in-depth case study of the El Niño Southern Oscillation (ENSO), comparing ocean and atmospheric conditions in the equatorial Pacific Ocean during normal, El Niño, and La Niña phases. Finally, students examine the global climatic effects of these events.
Unit 4 – Marine Productivity | Sample
Students compare terrestrial and marine productivity, examining how the availability of key resources dictates the amount of productivity in ocean surface waters. They also assess the biological and societal importance of primary productivity. Finally, a case study of dead zones on both a regional and global scale highlights the severe negative anthropogenic impacts that threaten nearshore waters. back to top
