A GIS-based Curriculum on Tropical Cyclones
Michael Mayhew and Michelle Hall
Science Education Solutions, Inc.,
and the Institute of STEM Education New Mexico
Cyclone Science is a four-unit curriculum, with exercises using the easy-to-use, open source QGIS software. The curriculum is aimed at students in Earth science courses at the early college level.
Detailed instructions guide students through the exercises. Questions along the way test students’ understandings. The curricular units contain abundant readings, illustrations, photos, and videos. Students are able to create plots and tables.
The curriculum enables students’ in-depth learning in an enjoyable way about the processes and impacts of tropical cyclones, but also exposes them to the power of GIS in analyzing multiple large data sets, which may prove beneficial in a wide range of technology-based occupation in the future.
The curriculum consists of an Introduction and four units:
Introduction. This is an in-depth tutorial on downloading and using the QGIS software. It also contains a section on the instructional design philosophy underlying the curriculum.
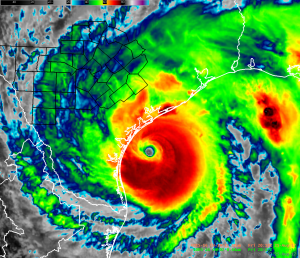
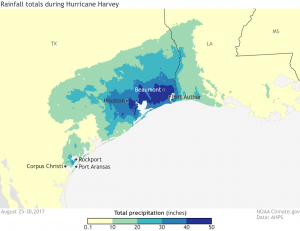
Unit 1: Recipe for a Cyclone. The unit begins with two readings, the first a facsimile report on the 1900 hurricane that killed half the population of Galveston, Texas, written by the meteorologist who lived through it; the second is a report on Hurricane Harvey of 2017, which caused nightmare flooding along the Texas Coast.
Students then explore with GIS the global patterns of tropical cyclones, the Saffir-Simpson scale, and the basic characteristics of all tropical cyclones, including their seasonality. The unit includes a tutorial on the role of solar energy in driving cyclones, the importance of the Coriolis effect in controlling their motion, and the process of intensification in their formation and development.
Unit 2: The Life of a Cyclone. The unit begins with an overview of the suite of techniques that are applied to observations of tropical cyclones and an explanation of the nature of models in general and weather models in particular.
Next is a case study of a particular hurricane, Hurricane Georges, as it traversed the North Atlantic. Students determine variations in Georges’ size, intensity, and speed along its path and the countries and U.S. states that it impacted using the tools of GIS.
Using a data base of hurricane tracks from the North Atlantic, students study the overall pattern of hurricane paths, including where they form and where they die. They study global wind patterns that drive the movement of hurricanes. Students then study how tropical cyclones are classified according to degree of organization and wind speed.

Students determine the relationship between damage costs and average hurricane intensity for Atlantic hurricanes between 1950 and 2017 by generating a histogram. Finally, they study the relationship between hurricane intensity and sea surface temperature.
Unit 3: Hurricane Hazards. This unit is focused on the impacts of tropical storms on human life and property. It begins with an engrossing excerpt from the 1929 novel, High Wind in Jamaica by Richard Hughes in order to get students “in the right frame of mind” for this unit.
Students consult NOAA webpages to learn about the multiple kinds of hazards associated with tropical cyclones. They learn the distinction between hazard and risk. Much of the remainder of the unit is built around a comprehensive NOAA catalog of hurricanes that significantly impacted Atlantic and Gulf of Mexico states from Texas to Maine between 1851 and 2018.
Students use the data to fill in a table showing the number of hurricanes that impacted the state, the percentage of hurricanes of hurricanes impacting the state, and the probability of such impact. They then generate a bar plot showing the number of hurricanes impacting each state and interpret the plot. They generate a map showing via a color scale the variation in impact across all of the states.
Next is a reading describing the impacts of five devastating hurricanes: Mitch (1998), Andrew (1992), Floyd (1999), Katrina (2005), and the Galveston hurricane of 1900. The description of the Galveston hurricane includes an excerpt from Isaac’s Storm by Erik Larson (1999).
Students use the NOAA data to generate—and then seek to interpret—a plot of cost versus fatalities…is there a correlation? They generate a map of the tracks of the top ten most destruction hurricanes and look for commonalities and anomalies. They generate a plot of cost of hurricane impact over time and look for possible trends. They then do the same for a plot of fatalities over time. Finally, they develop an estimate of the hurricane risk for each of the Gulf- and Atlantic-facing states. The unit closes with an examination of “Florida’s summer of 2004,” when the state was overrun by no less than four devastating hurricanes.

Rainfall totals during Hurricane Harvey

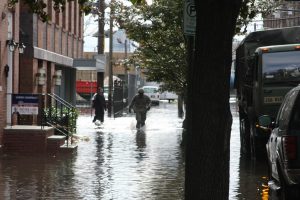
Flooding in New York City during Hurricane Sandy
Unit 4: Hurricane Sandy. This unit is a case study of one particularly devastating hurricane, Hurricane Sandy of 2012. The unit begins with a reading on hurricane’s hitting the New York City region historically, followed by an overview of Sandy’s origin, evolution, and impact. In a map view of Sandy’s track, they analyze its variation in its intensity with time. They study how variation in the coastline of the Eastern Seaboard could intensify a hurricane’s storm surge.
Students then use a map view of the New York City region to study the extent of flooding predicted for hurricane intensities 1-4 by NOAA’s SLOSH Inundation Zones model. This is compared with the actual inundation due to Hurricane Sandy.
Students next use GIS map views to study the impact of Hurricane Sandy’s storm surge on coastal dwellings and their inhabitants regionally. They zoom in for a detailed look at localities in Staten Island and the Breezy Point section of coastal Queens.
The final section of the unit is titled, “What if…?”. Hurricane Sandy came ashore as a Category 1 storm. What if the New York City region were to be hit by a Category 4 storm that followed the same track? The unit opens with a reading on the impact of Typhoon Haiyan on the Philippines in 2013, just to provide a feeling for the wreckage that a major storm can produce.
Students apply the NOAA SLOSH model to predict the fraction of major infrastructure likely to be overrun by a Category 4 hurricane: power plants, subway entrances, hospitals, schools, firehouses, and wastewater treatment plants. They also estimate the fraction of the New York City population lying within the hypothetical flood zone.
Download and install the QGIS for your operating system
The QGIS site provides step by step instructions for installation of the software.
Download the Projects and Curriculum
https://www.dropbox.com/s/ln749aijdh3eute/Final%20Distribution%20of%20Cyclones%202019.zip?dl=0
You will get a message like this—> click the download and you will be set to go! 
For assistance with the curriculum and to get a copy of the Instructors version, contact hall at scieds dot com
Acknowledgments:
Creation of this curriculum would not have been possible without expert input from the following:
Kurt Menke of Bird’s Eye View GIS developed all the instructions for using the GIS software.
Larry Kendall, Education and Technology Instructor, created the elegant layout for the curriculum.
Scott Walker of the Harvard Map Library was instrumental in locating key data sets.
We are grateful to each of them, not only for bringing their expertise to the project, but for their persistent high standards, professionalism, and attention to detail.
This curriculum is based upon work supported by the National Science Foundation under Grants No. DUE-9555205, IMD-9986613, EAR-9809704, GRD-9979670, and IUES-1433573.
Any opinions, findings, and conclusions or recommendations expressed in this material are those of the authors and do not necessarily reflect the views of the National Science Foundation.
